


 14 / 166

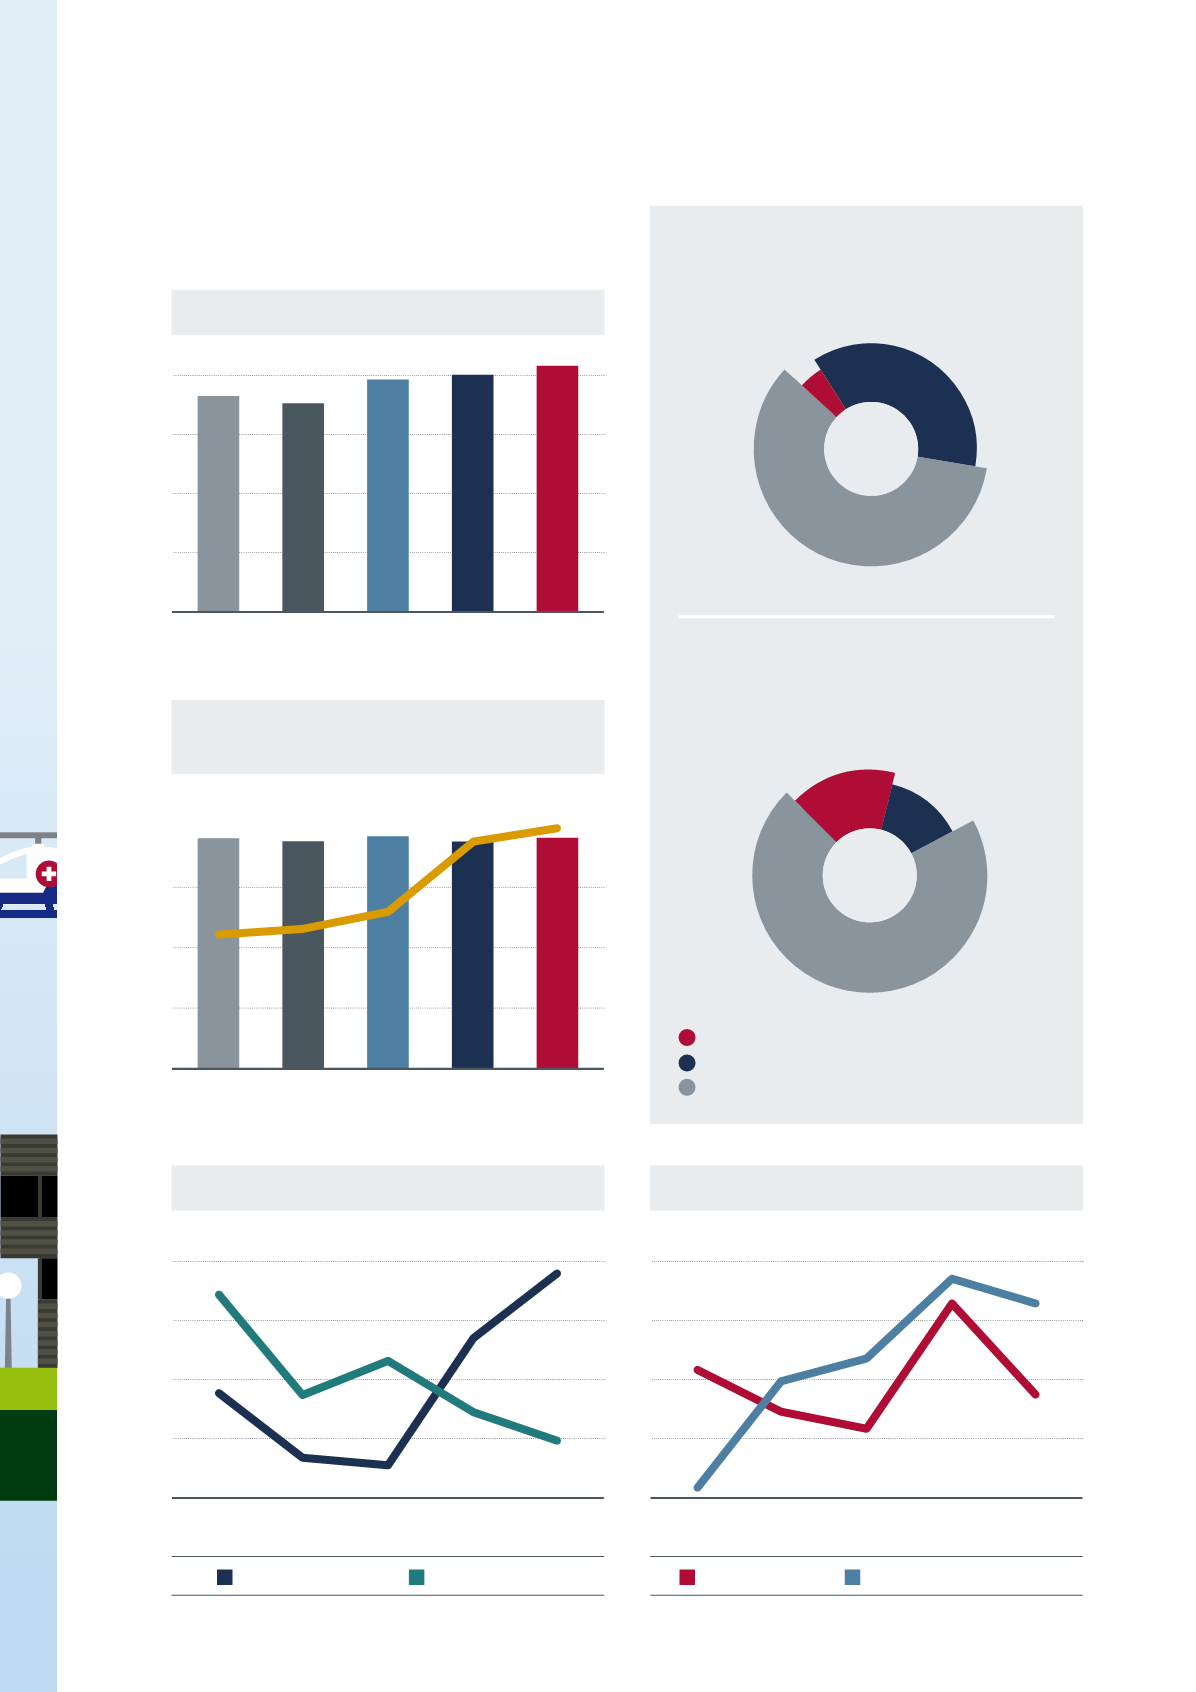
Cuotas Devengadas
Cuota de Mercado Sector 25,53%
1.3 FREMAP y sus Cifras
2010
360.884
2011
343.108
2012
392.846
2013
400.658
2014
402.226
Participación en el Sector 25,98%
Resultado a Distribuir
CESE DE ACTIVIDAD
CONTINGENCIAS COMUNES
CONTINGENCIAS PROFESIONALES
2010
2011
2012
2013
2014
10,25
3.051
13,93
2.745
14,63
2.621
17,39
3.648
2.888
16,54
SOLICITUDES
IMPORTE
(millones de euros)
Empresas Asociadas
2010
3.950.354 3.873.725 3.786.360 3.853.764
2011
2012
2013
2014
3.960.831
22,99% 23,03%
23,18%
23,70%
23,79%
Trabajadores Protegidos
/
% Cuota Mercado Sistema
Incentivo por Reducción Siniestralidad
BONUS
Actividad Preventiva
2010
2011
2012
2013
2014
80.606
17.518
70.924
14.647
73.387
14.165
68.499
20.719
24.007
65.920
Nº ACTIVIDADES
Nº EMPRESAS
14
1. Presentación
47
938
1.456
2.441
millones
de euros
2.441
millonesdeeuros
190,40
44,82
35,88
271,10
millones
de euros
271,10
millonesdeeuros