


 53 / 166

3.1 Recursos Humanos
53
2014
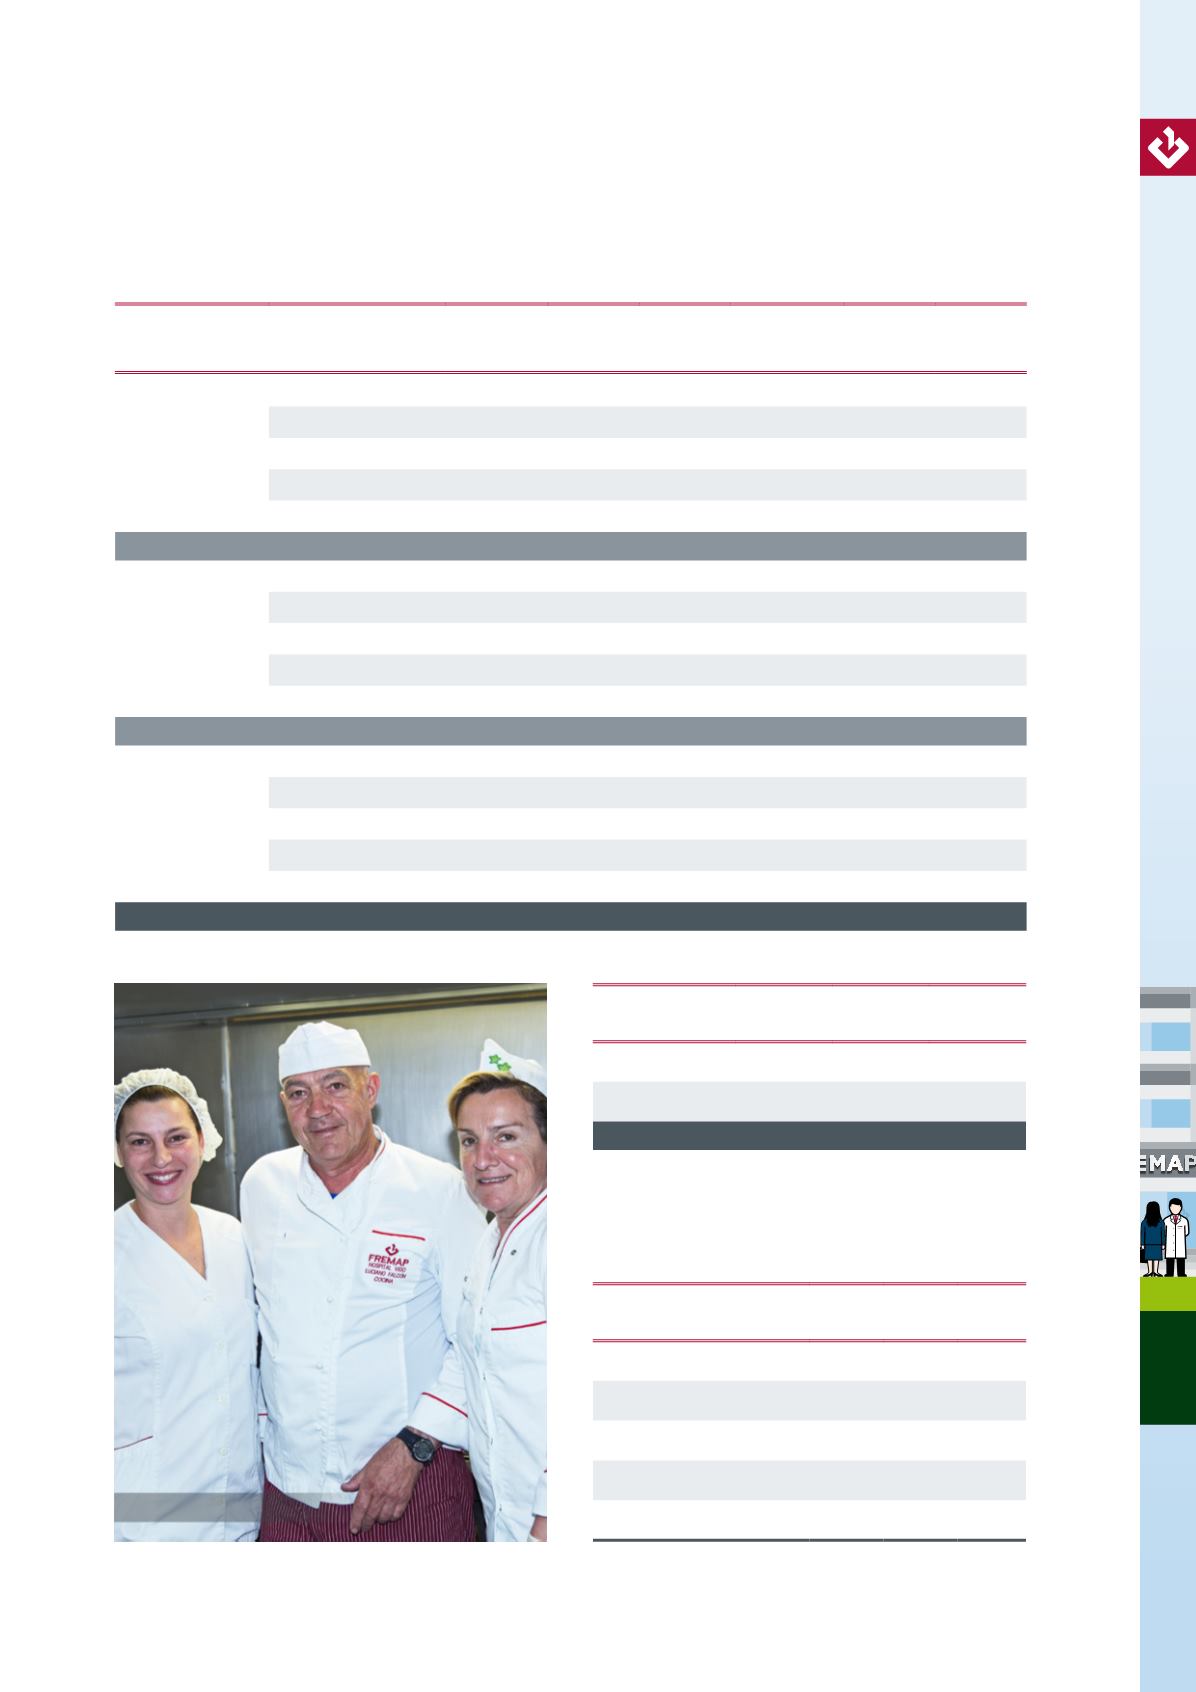
Empleados Hospital de Vigo
EMPLEADOS
Grupos
Profesionales
Indefinido Temporal
Total
Completo
Parcial
Total
Mujer
Gestión
522
14
536
515
21
536
Prevención
50
1
51
50
1
51
Sanitaria
1.318
166
1.484
1.321
163
1.484
Soporte técnico
125
7
132
128
4
132
Servicios generales
33
3
36
32
4
36
TOTAL
2.048
191
2.239
2.046
193
2.239
Hombre
Gestión
751
13
764
745
19
764
Prevención
97
1
98
87
11
98
Sanitaria
746
57
803
678
125
803
Soporte técnico
161
4
165
155
10
165
Servicios generales
38
3
41
38
3
41
TOTAL
1.793
78
1.871
1.703
168
1.871
Total
Gestión
1.273
27
1.300
1.260
40
1.300
Prevención
147
2
149
137
12
149
Sanitaria
2.064
223
2.287
1.999
288
2.287
Soporte técnico
286
11
297
283
14
297
Servicios generales
71
6
77
70
7
77
TOTAL
3.841
269
4.110
3.749
361
4.110
La distribución de la plantilla (a 31 de diciembre de 2014)
El índice de rotación de nuestros empleados se situó en
el 2,14%,siendo algunas de las causas las indicadas en el
siguiente cuadro:
EDAD
<30
30-50
>50
Mujeres
213
1.659
371
Hombres
81
1.187
599
Total
294
2.846
970
CAUSA DE LAS BAJAS Hombres Mujeres Total
Jubilación
20
4 24
Despido
4
3
7
Fallecimiento/Incapacidad
3
8 11
Voluntarias
6
7 13
Otras
18
57 75