


 12 / 60

1. Presentación
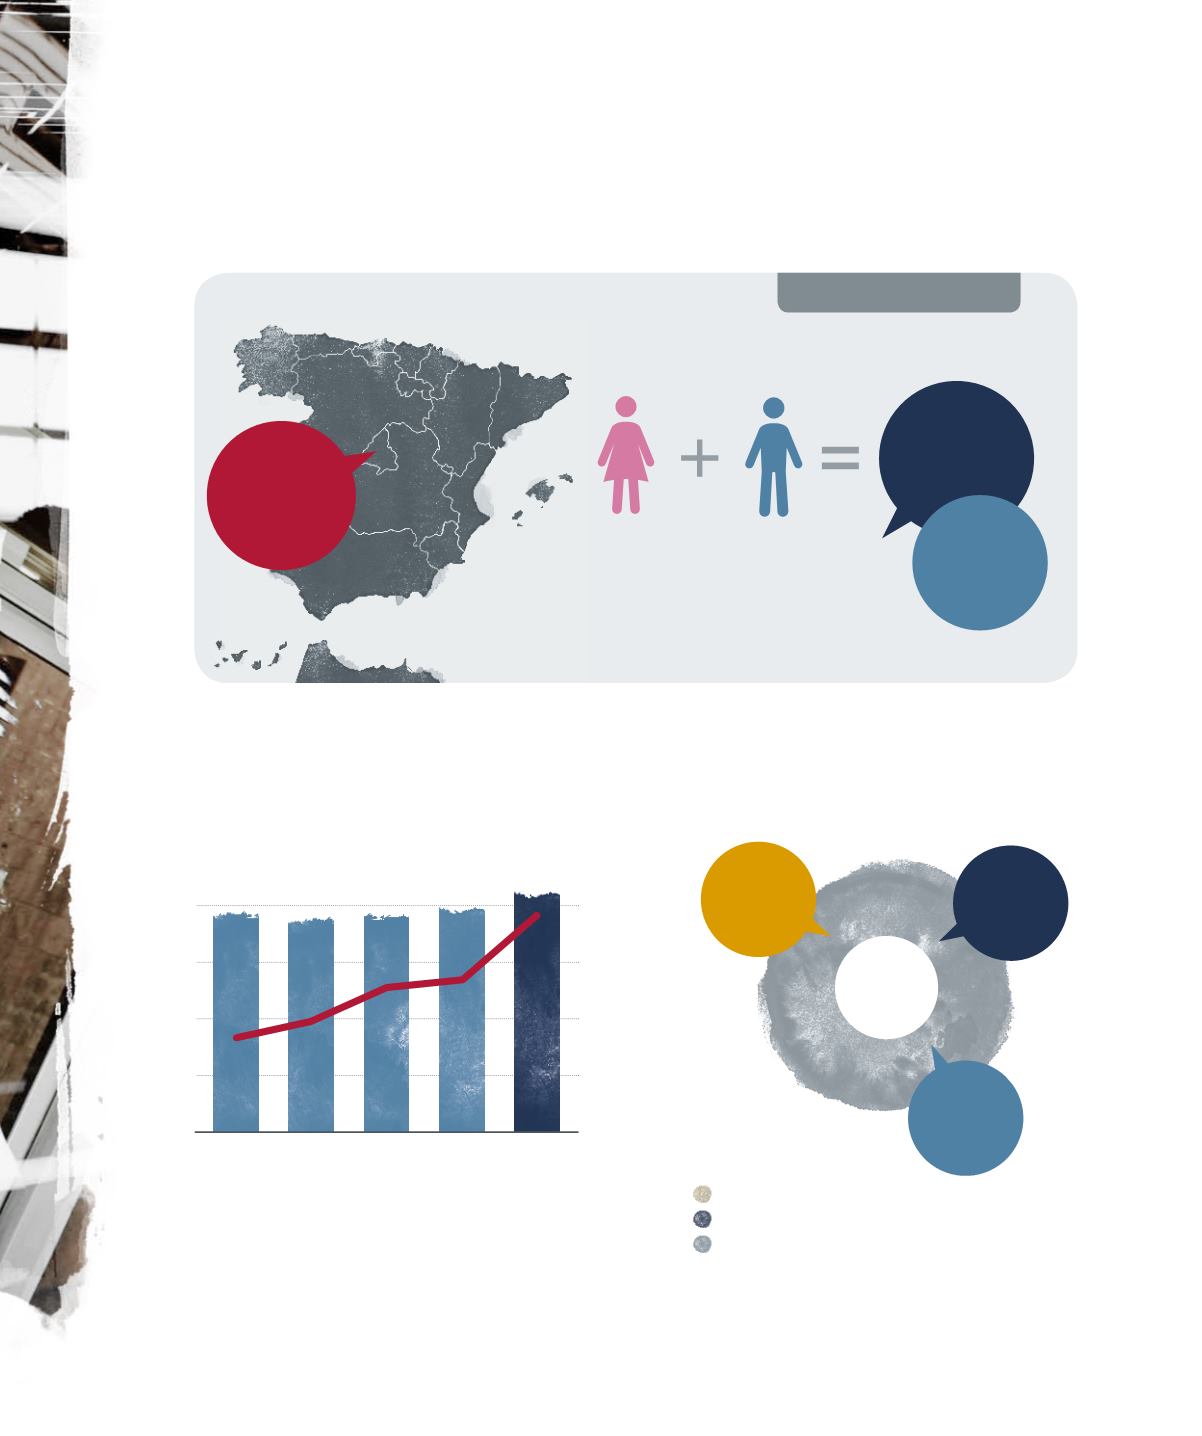
FREMAP y sus Cifras
4.211
Empleados
44,81%
1.887 HOMBRES
55,19%
2.324 MUJERES
Centros y Empleados
4.001
210
ESTRUCTURALES
TEMPORALES
CESE DE ACTIVIDAD
CONTINGENCIAS COMUNES
CONTINGENCIAS PROFESIONALES
Trabajadores Protegidos /
% Cuota Mercado Sistema
2011
3.873.725 3.786.360
2012
2013
2014
2015
23,03%
23,18%
23,70%
23,79%
24,42%
3.853.764 3.960.831
4.196.065
323,53
millones de euros
Resultado a Distribuir
54,89
-49,83
318,47
211
Centros de
Atención
8